pyobsmod.plots.scatter_plot_sns#
- pyobsmod.plots.scatter_plot_sns(obs: ndarray, mod: ndarray, which_stats: Sequence[str] | dict[str, Any] | None = None, names: Sequence[str] | None = None, fmt: str | Sequence[str] = '.2f', idline_kws: dict[str, Any] | None = None, textbox_kws: dict[str, Any] | None = None, **kwargs) JointGrid#
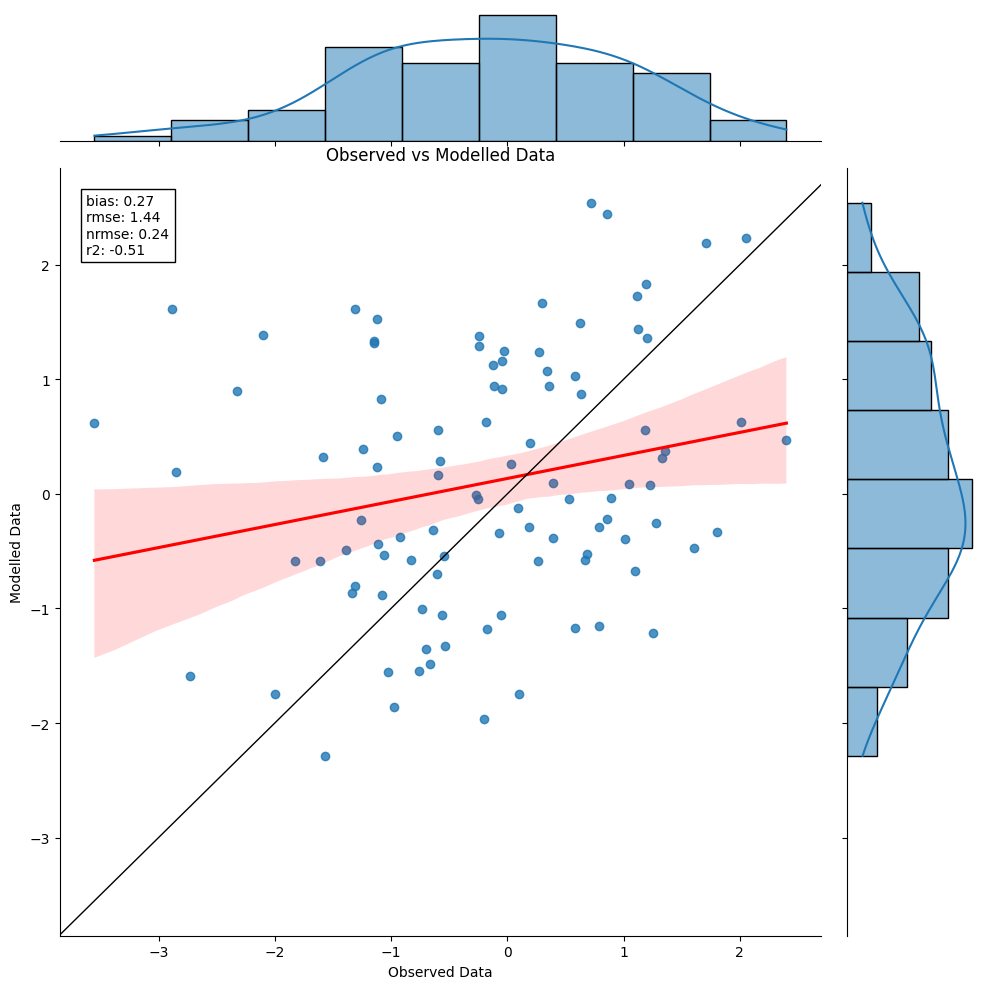
Scatter plot sns of observed data against modelled data.
Add an identity line and display selected statistics with seaborn’s jointplot.
Internally this function create a Dataset object and passes the arguments to the
Dataset.scatter_plot_snsmethod.- Parameters:
obs (numpy.ndarray) – 1d numpy array that contains the data that was observed / measured.
mod (numpy.ndarray) – 1d numpy array that contains the data that was predicted / modelled.
which_stats (Sequence[str] | dict[str, Any] | None) – Sequence of the statistics parameters to compute or alternatively a dictionary with the statistics parameters as keys and the arguments that are passed to the method as values.
names (Sequence[str] | None) – Sequence of the names of the statistics parameters. If None, the names are taken from the keys of the which_stats dictionary.
fmt (str | Sequence[str]) – Format string for the statistics. Can be a single string that is used for all statistics or a sequence of strings that is used for
idline_kws (dict[str, Any] | None) – Dictionary that is passed to
matplotlib.pyplot.axline.textbox_kws (dict[str, Any] | None) – Dictionary that is passed to
matplotlib.offsetbox.AnchoredText.**kwargs – Additional arguments that are passed to
seaborn.jointplot.
- Returns:
grid – An instance of a seaborn JointGrid.
- Return type:
seaborn.JointGrid
Notes
Note that in contrast to
plots.scatter_plotandplots.time_series_plotthis method does NOT take amatplotlib.pyplot.Axesobject as an argument, since the underlying function creates a figure and several axes objects itself.In practice this means simply, that this plot can NOT be used in subplots (without major work-arounds).
Examples
import matplotlib.pyplot as plt
import numpy as np
import pyobsmod.plots as pp

obs = np.sin(np.arange(100)) + np.random.normal(size=100)
mod = np.sin(np.arange(100)) + np.random.normal(size=100)
g = pp.scatter_plot_sns(obs, mod, ['bias', 'rmse', 'nrmse', 'r2'])
plt.show()