pyobsmod.Dataset.scatter_plot#
- Dataset.scatter_plot(which_stats: Sequence[str] | dict[str, Any] | None = None, names: Sequence[str] | None = None, fmt: str | Sequence[str] = '.2f', ax: Axes | None = None, idline_kws: dict[str, Any] | None = None, textbox_kws: dict[str, Any] | None = None, **kwargs) Axes#
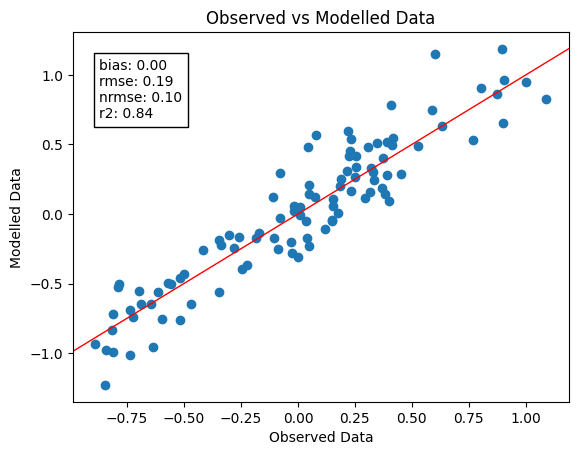
Scatter plot of observed data against modelled data.
Add an identity line and display selected statistics.
- Parameters:
which_stats (Sequence[str] | dict[str, Any] | None) – Sequence of the statistics parameters to compute or alternatively a dictionary with the statistics parameters as keys and the arguments that are passed to the method as values.
names (Sequence[str] | None) – Sequence of the names of the statistics parameters. If None, the names are taken from the keys of the which_stats dictionary.
fmt (str | Sequence[str]) – Format string for the statistics. Can be a single string that is used for all statistics or a sequence of strings that is used for each statistic individually
ax (plt.Axes | None) – Matplotlib axis to draw the plot on.
idline_kws (dict[str, Any] | None) – Dictionary that is passed to
matplotlib.pyplot.axline.textbox_kws (dict[str, Any] | None) – Dictionary that is passed to
matplotlib.offsetbox.AnchoredText.**kwargs – Additional arguments that are passed to
matplotlib.pyplot.scatter.
- Returns:
ax – The Matplotlib axes.
- Return type:
matplotlib.pyplot.Axes
Examples
import matplotlib.pyplot as plt

from pyobsmod import load_dataset_example

ds = load_dataset_example()
ds.scatter_plot(['bias', 'rmse', 'nrmse', 'r2'])
plt.show()